
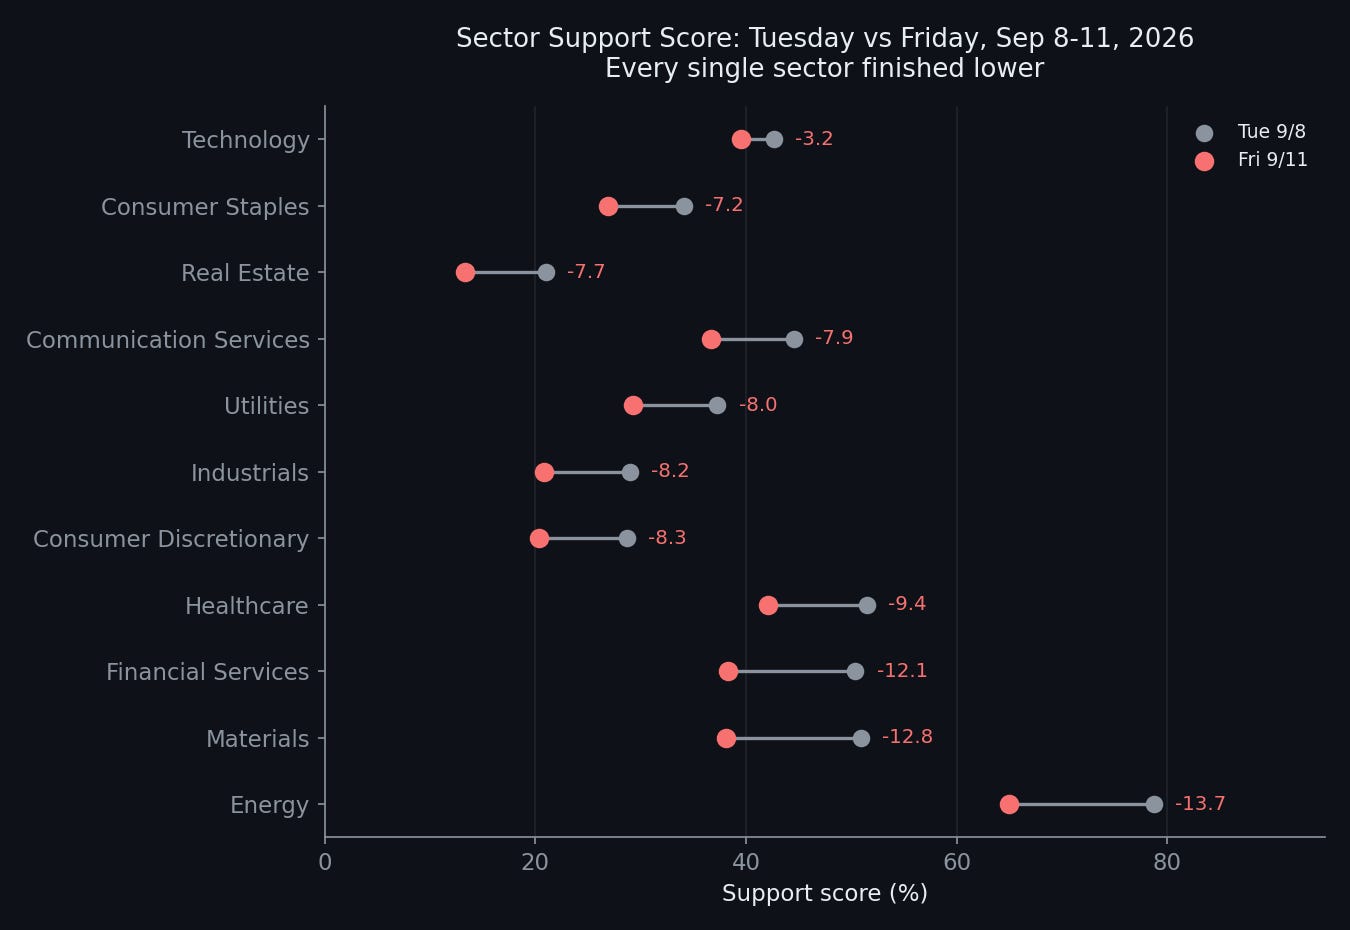
Every single sector on my board finished this week lower than it started. Not most. All eleven. Technology held up best, down 3.2 points. Energy fell the most, down 13.7. Everything in between was red too. In two months of tracking this board, I have never shown you a week where the dumbbell chart had no green in it at all.
The shape of the week
This was a shortened week, Labor Day closed markets Monday, so four sessions instead of five. The sector-average support score opened Tuesday at 42.6, already below last week’s 44.3 close, then fell every single day: 38.7 Wednesday, 34.8 Thursday, 33.7 Friday. That is a clean, uninterrupted slide with no bounce at any point, and it is the fifth straight week of lower Friday closes, all the way back from 64.6 a month ago.
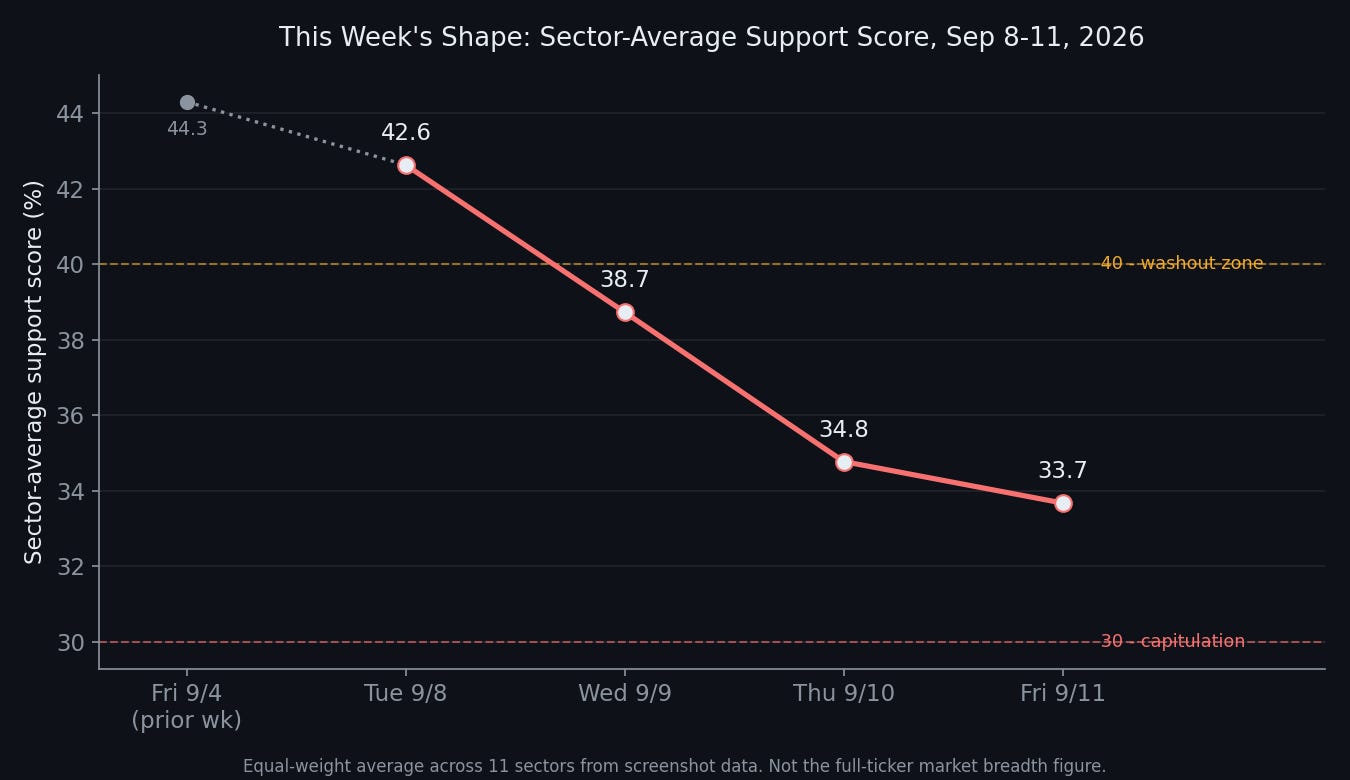
Here is the part worth sitting with. I recently published a full breakdown of what ten years of this exact score have historically meant at different levels, and marked three reference lines: 50 as neutral, 40 as a washout zone, 30 as outright capitulation. Friday’s close of 33.7 sits just above that capitulation line, inside the washout zone the whole week actually crossed through on the way down. History says this specific zone, readings at or below 40, has preceded above-average market returns over the following month more often than not. History also says that signal has failed to mark a bottom during genuine, ongoing bear markets, the COVID crash and the 2022 bear market both saw readings this low followed by significantly more downside, not less. I am not going to tell you which one this is. I am going to tell you plainly that we are now sitting in exactly the zone where that question matters a great deal.
What actually happened
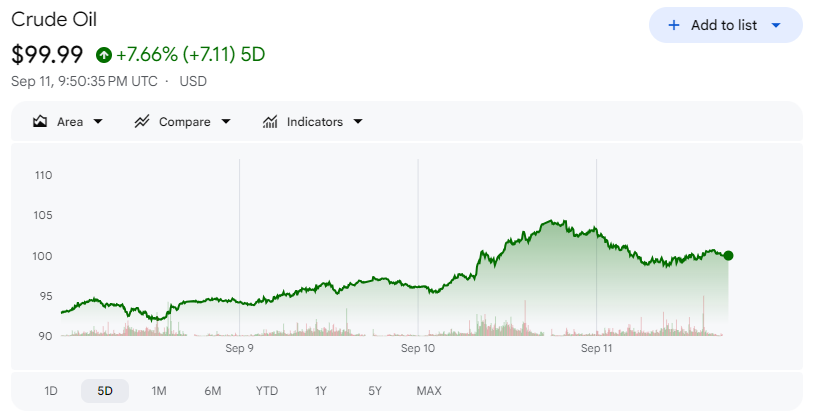
Oil, again, and now central banks are responding to it directly rather than just watching it. Crude rallied roughly 9 to 10 percent for the second straight week, WTI up 9.37 percent this week on top of last week’s 9.69 percent, close to a 20 percent two-week move on renewed Middle East escalation. Inflation data has strengthened expectations for a September rate hike. The combination of bad breadth, increasing odds of a rate hike, and a discerning consumer mentality clear foreshadow risk heading into what has historically been the peak period of volatility for stocks. The Fed risks falling even further behind the cruve at this point.
This is no longer a debate about whether the Fed cuts less than hoped. The September 16 Federal Reserve meeting is now on the calendar with a consensus and forecast of 4.00 percent, a full quarter-point hike from the current 3.75 percent. Three weeks ago the story was a hawkish Fed chair removing the case for a cut. Two weeks ago it was a strong jobs report reviving hike talk. This week it is priced consensus for an actual hike. That progression, cut hopes to no cut to priced hike, in the space of a month, is the clearest single thread running through the market right now.
It is not just the Fed. The ECB actually raised rates this week, not held, cited persistent inflation risk explicitly. Japan faces its own rate-hike expectations on the back of rising JGB yields. Three of the world’s major central banks are leaning hawkish in the same short window, and the common thread behind all three is the same oil shock that has now run for three consecutive weeks.

A discerning consumer mentality has crept into the narrative more prominently as sentiment slid for a second straight month. August payrolls did come in strong, and consumer sentiment has still been softening underneath that headline number, a genuinely mixed signal rather than a clean resolution in either direction.
The cross-asset picture argues this is real, not just noise
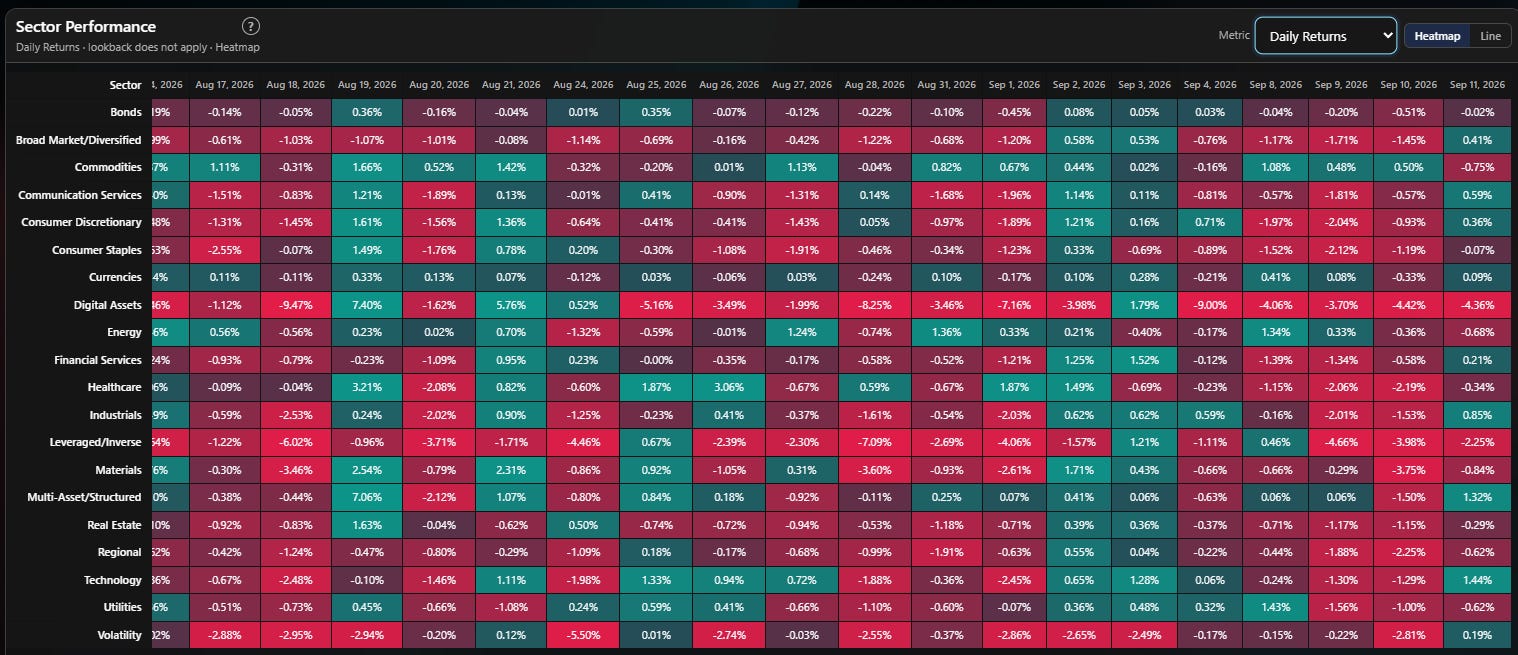
If you are inclined to write off a four-day slide as short-term positioning, the rest of the tape this week does not support that read. The Russell 2000 fell 2.40 percent, small caps usually take the hardest hit when rate expectations move against risk assets. Bitcoin fell 3.40 percent and the Digital Assets row on my sector-performance data was red every single day this week. The 30-year bond fell 1.78 percent, meaning long yields rose, consistent with a market pricing tighter policy for longer. And SPY itself was actually down this week, roughly 0.8 percent by the S&P 500 futures reading, not just my board. For the past month I have been showing you a gap between SPY holding firm-ish and this board’s breadth cracking underneath it. This week, for the first time in that stretch, price started catching down to what positioning had already been signaling.
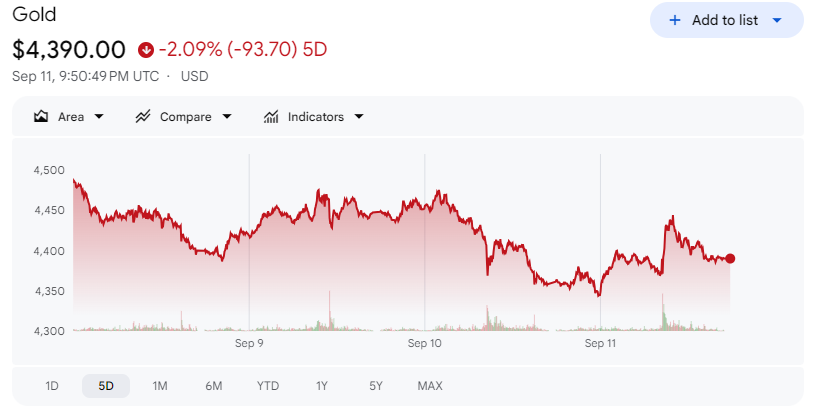
Gold fell 1.51 percent this week, silver fell 2.34 percent, platinum fell 1.56 percent, all for a second straight week. If oil’s rally were a broad flight-to-real-assets or currency-debasement story, precious metals would likely be moving with it rather than against it two weeks running. This continues to look like a specific, geopolitically driven energy shock working its way through rate expectations, not a broader statement about the dollar or a case for holding hard assets generally.
Where individual sectors stand after a week like this
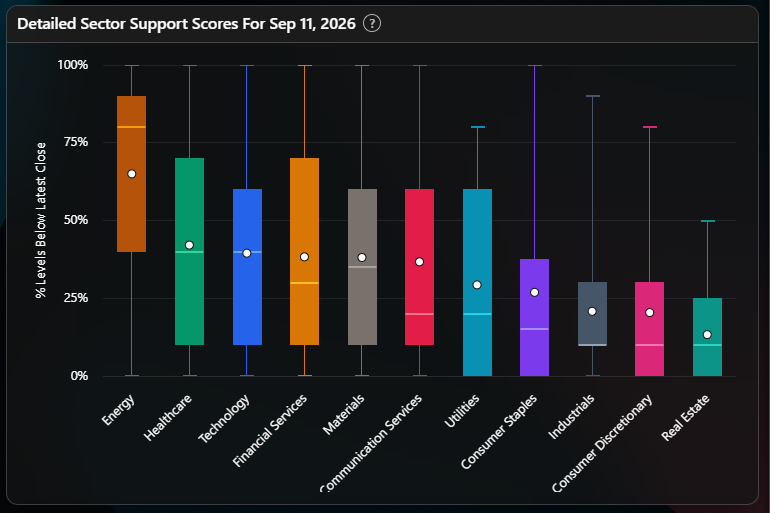
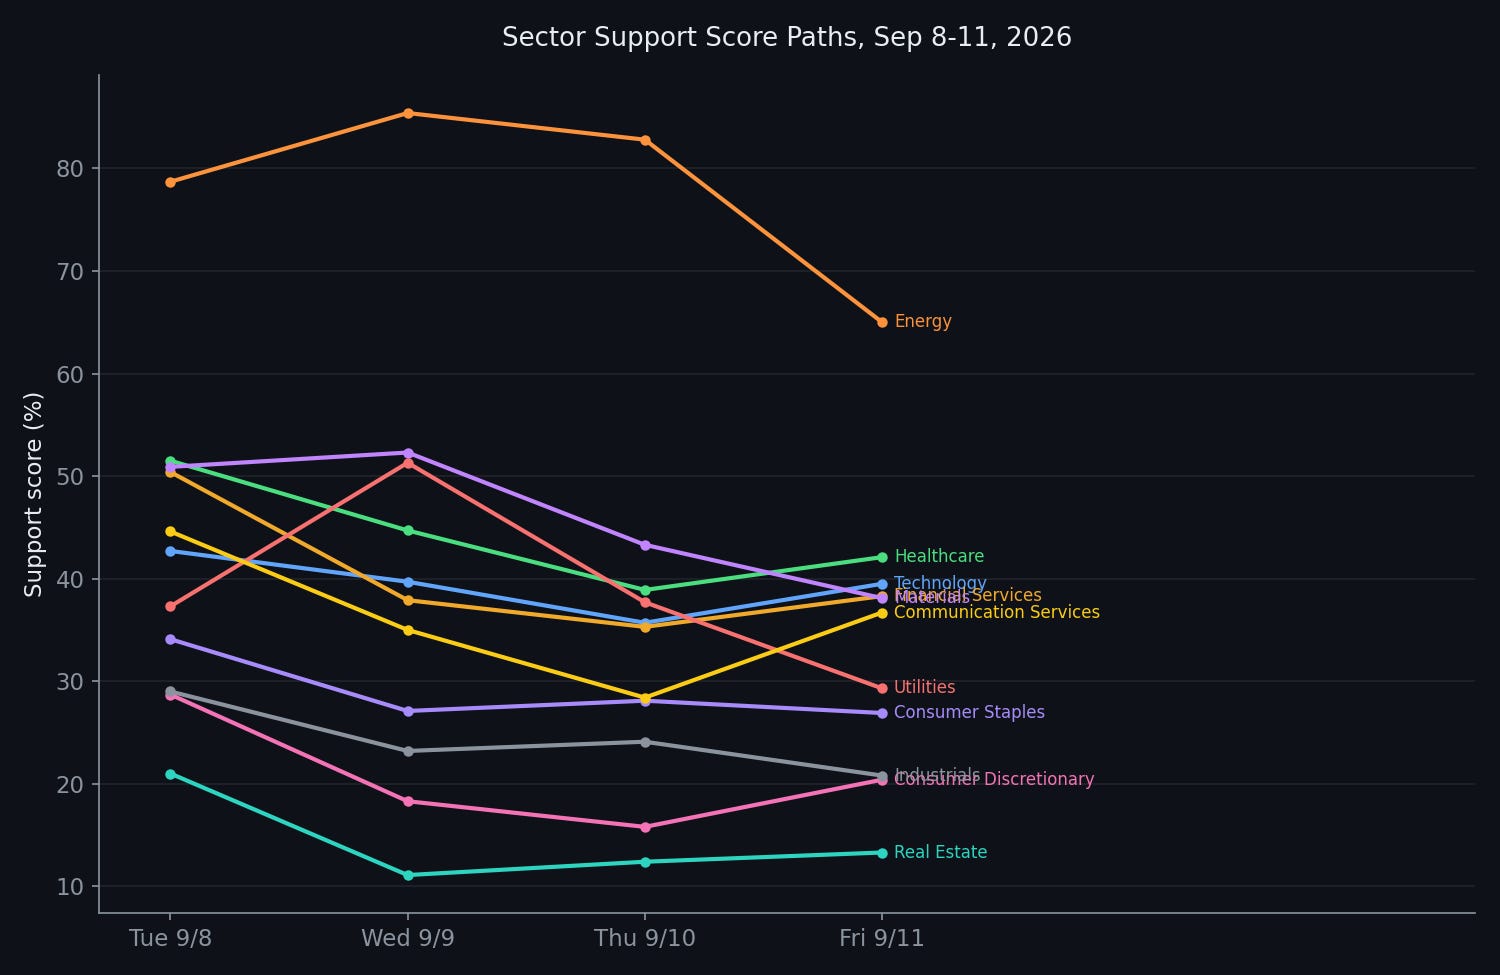
Energy fell the most in points this week, 13.7, but it is worth being precise about what that means next to everything else. Even after that drop, Energy’s own detailed breakdown Friday still shows the highest median and mean of any sector on the board, still the strongest sector by both of my independent measures even on its worst week in over a month. Compare that to Real Estate, which fell 7.7 points to a level where median and mean have now converged near the bottom of the range, not a skewed sector propped up by a few names anymore, a sector where the typical name and the average name are both simply broken.
(Help reading the whisker plot can be found here)
Financial Services and Communication Services both show a different pattern worth flagging: means sitting above already-low medians, meaning a handful of stronger names are still propping up headline scores that already look weak, and the typical name in each is worse off than even this week’s poor number suggests. Technology shows the same pattern in miniature, its own median sits meaningfully below its mean even as the sector held up best on points this week, a reminder that “held up best” and “healthy underneath” are not the same claim.
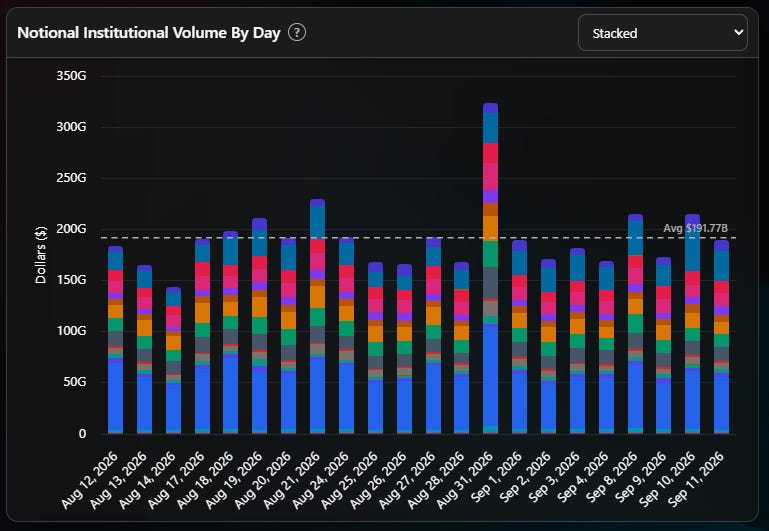
Notional institutional volume spiked hard on Monday, August 31, well above $300 billion against a running average near $190 billion, and stayed elevated most of this week too, several sessions above $200 billion. That is consistent with genuine repositioning around the oil and rate story rather than a quiet drift lower on thin volume. A five-day, all-red board on heavy volume is a different, more credible signal than the same move on a quiet tape would be.
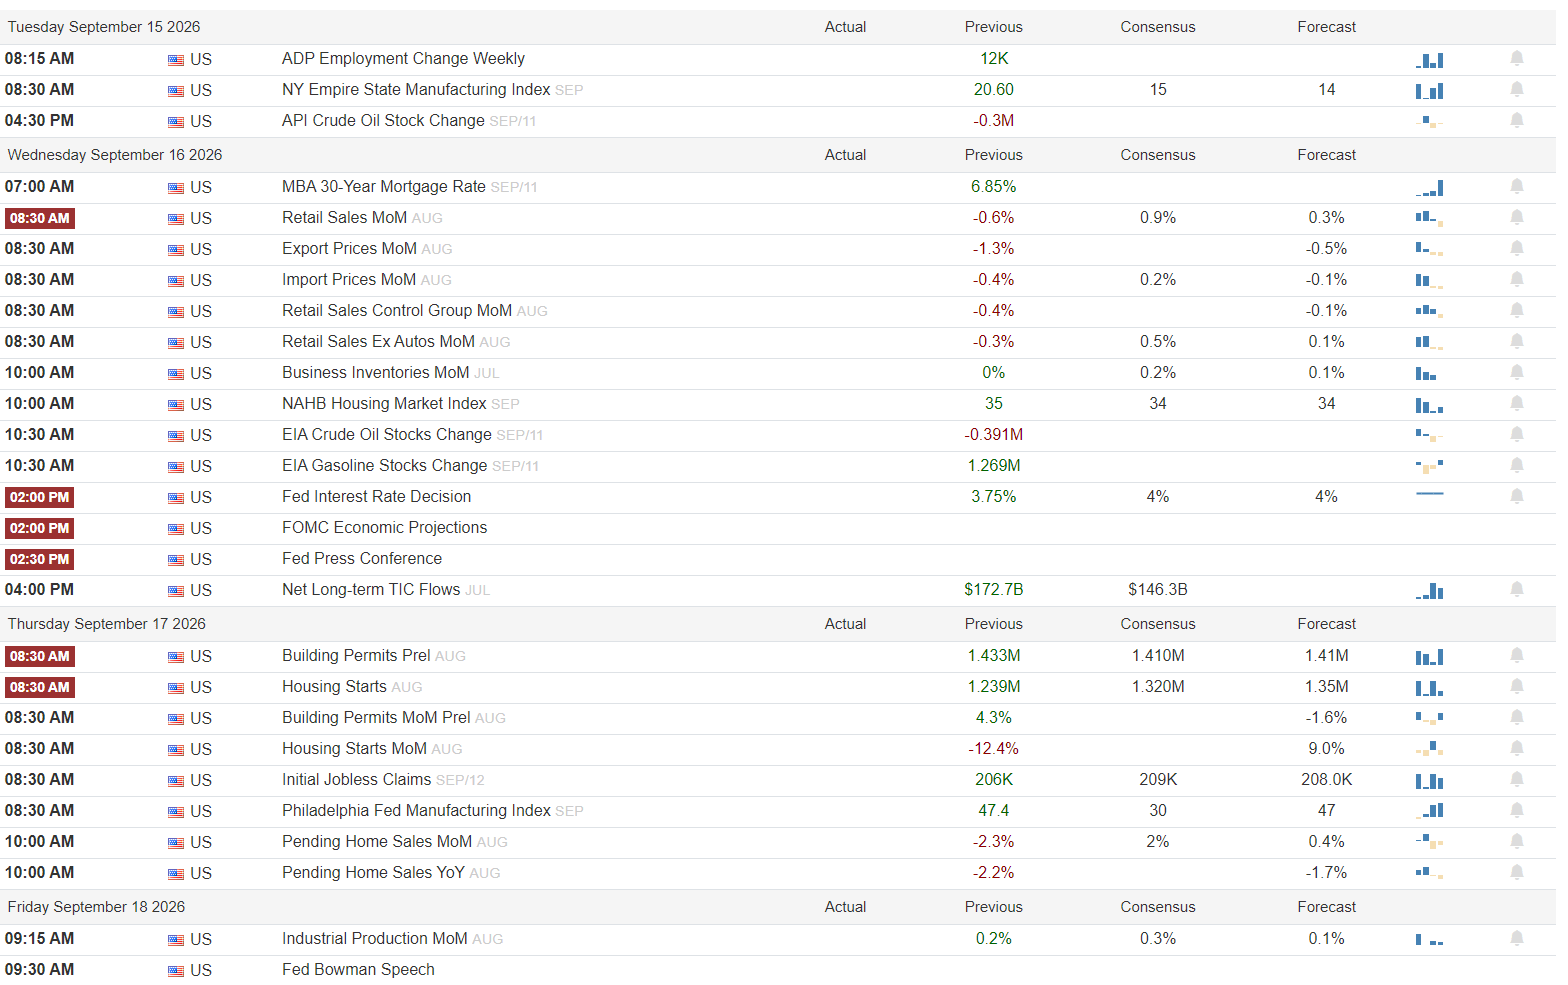
Next week is unusually loaded. The FOMC meeting itself lands Wednesday, September 16, with the rate decision, economic projections, and Fed press conference all landing in a three-hour window that afternoon. Retail sales, housing starts, and building permits all land the same week, on top of Fed Governor Bowman’s scheduled Friday remarks. If September 16 is the event this month, the days around it are not going to be quiet ones.
What this means, by your clock
If you trade in days to weeks: September 16 is now a real, dated event risk, not a vague topic. A market pricing a quarter-point hike that does not get one could move sharply in either direction depending on the actual statement and press conference, and a market that does get one is entering territory not seen in some time. The washout zone this average sector score just entered has historically favored a bounce over the following month, but “favored” is not “guaranteed,” and the exceptions on record are genuine bear markets, not garden-variety pullbacks. I would not treat this reading as a green light on its own, and I would treat Energy’s continued relative strength as the one thing on this board still worth differentiating from the broad selloff rather than assuming it eventually joins everything else down.
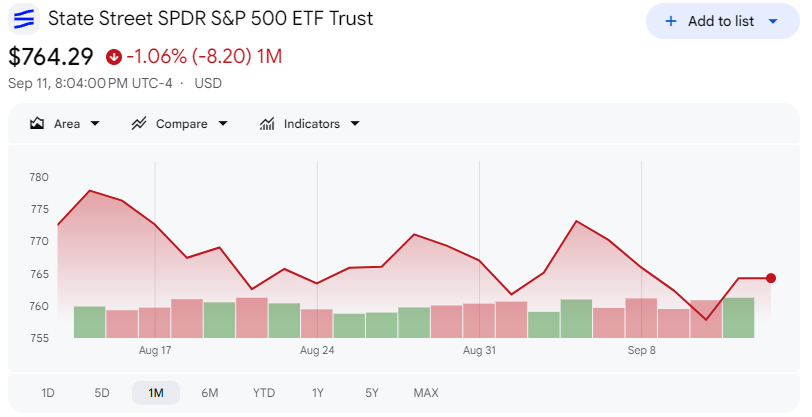
If you invest in months to years: five straight weeks of decline, a fully uniform sell-off with no sector spared, three central banks turning hawkish inside the same short window, and SPY finally joining the decline after a month of holding apart from it, that combination is a meaningfully different environment worth keeping a close eye on over coming sessions. Whether September 16 delivers the priced hike or not, the underlying story, an oil shock forcing a globally synchronized policy response, is bigger than any single sector rotation. Watch whether the softening consumer sentiment thread turns into something sharper in the data, that is the piece most likely to decide whether this stays a rate story or becomes a growth story too.
Talk soon, Bruce
If you’re not a subscriber yet, I’d love to have you. And if you’ve got questions about VolumeLeaders itself, what the data means, how to read the dashboard, anything, just reach out. Happy to answer them directly.
This newsletter is for informational purposes only and is not investment advice. Nothing here is a recommendation to buy or sell any security. Past patterns in this data are not a guarantee of future results, a point this piece has hopefully made concrete rather than just disclaimed.
Thank you for being part of this community and for investing your time in this week’s edition. The quality of this readership — thoughtful, disciplined, engaged — is what makes this work meaningful. I’m grateful to build alongside you. Here’s to a week of clarity, conviction, and well-executed opportunities.
— VolumeLeaders